
“We can only see a short distance ahead, but we can see plenty there that needs to be done”. Alan Turing, Computing machinery and intelligence. 1950
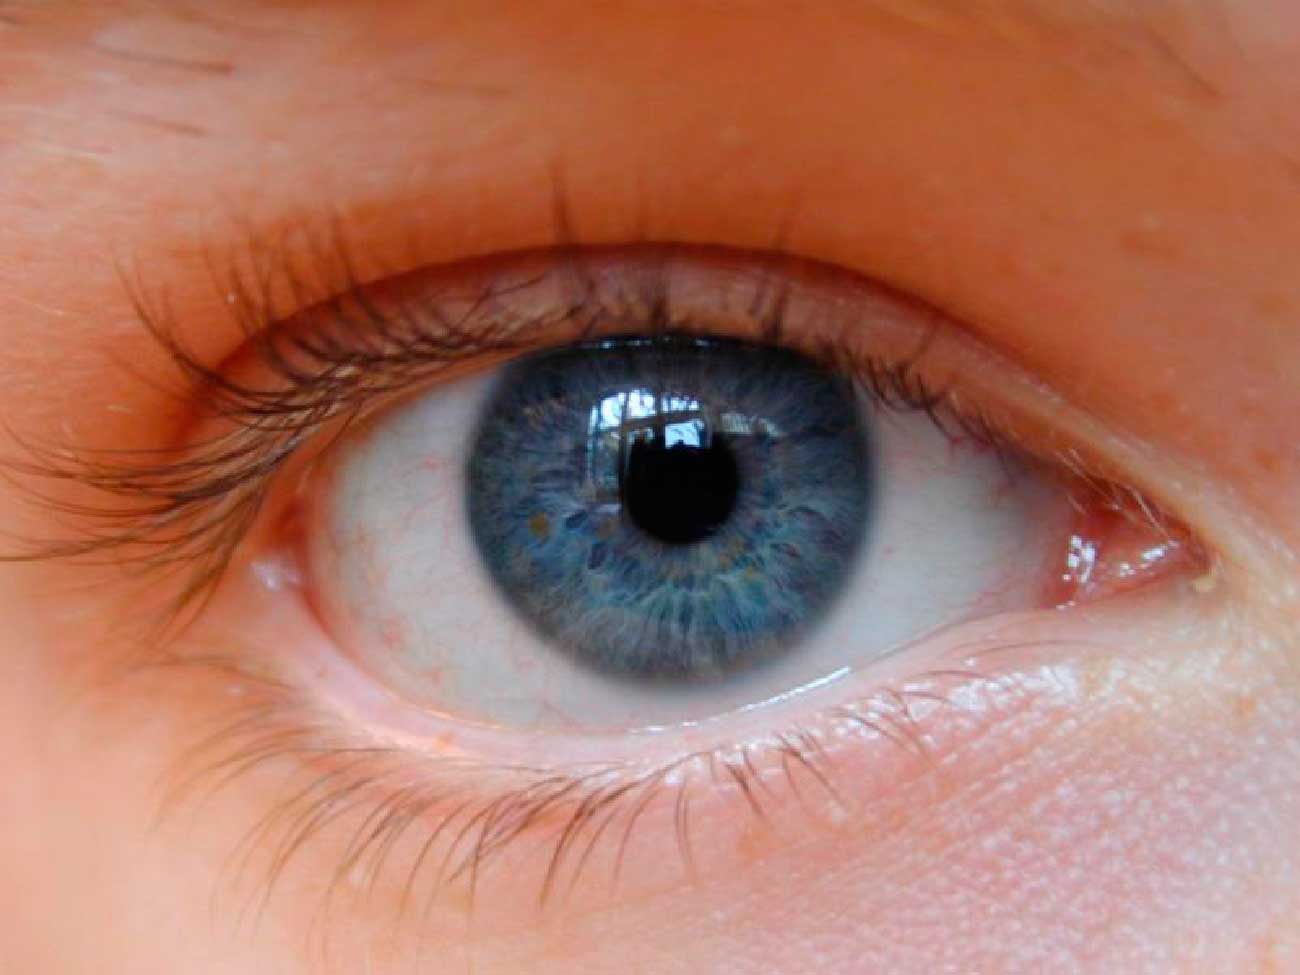
Our eyes are marvellous sense organs that allow us to appreciate all the beauty of the world we live in, to read and gain knowledge, and to communicate our thoughts and desires to each other through visual expression and visual arts.
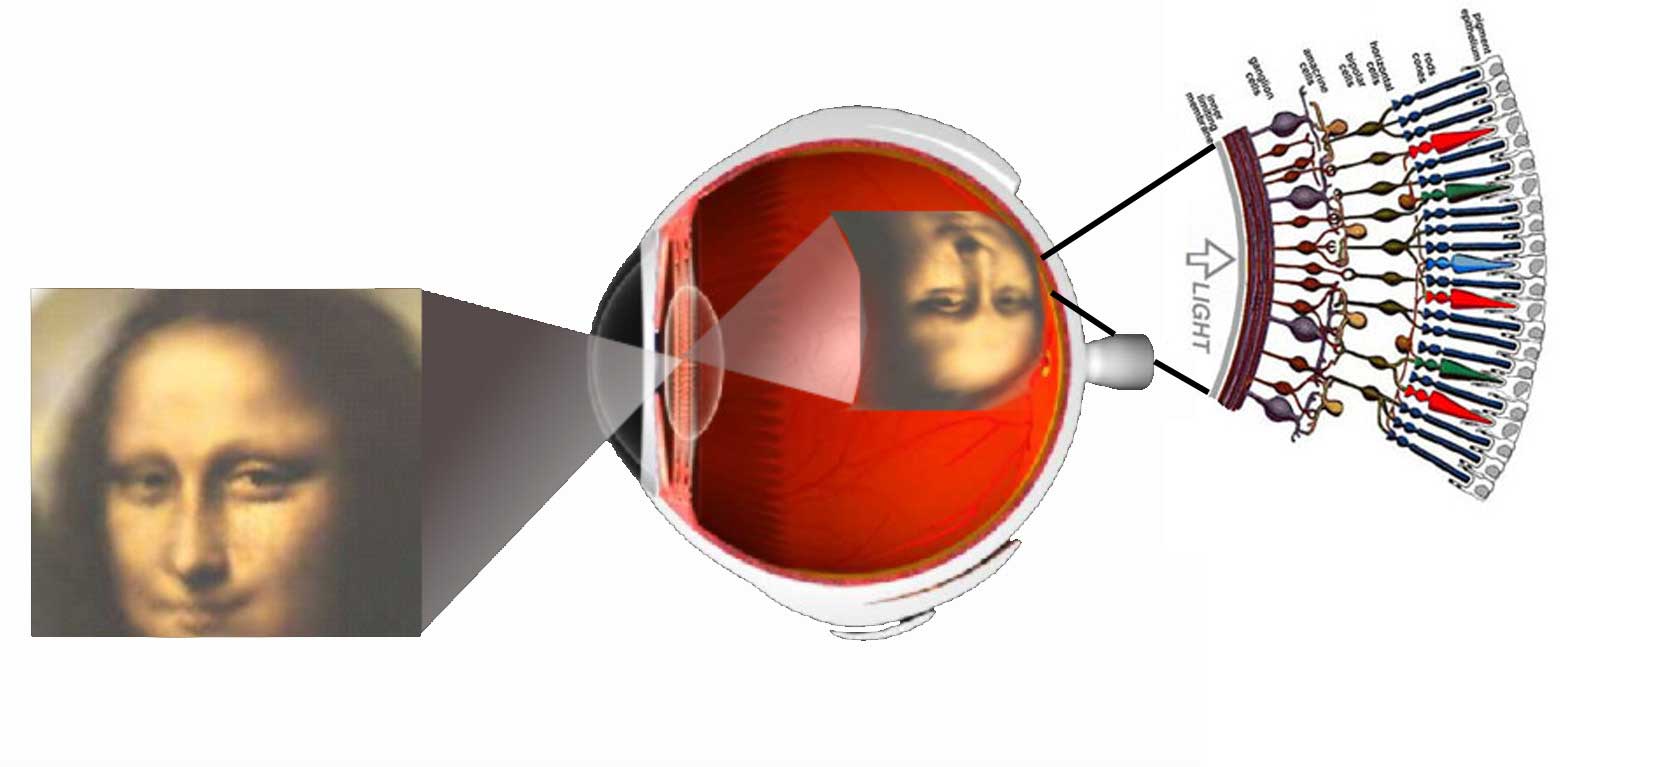
Vision is the most fundamental of our senses and it is perhaps the greatest tragedy of all when blindness robs us of this modality. Although all parts of the eye are important for perceiving a good image, the most vital layer for vision is the retina. The retina is essentially a piece of brain tissue that gets direct stimulation from the outside world’s lights and images.
Understanding the organization of the vertebrate retina has been and still is the goal of many talented visual scientists over the years. Ramon y Cajal in the 19th century presented the first comprehensive anatomic descriptions of the neural cell types that constitute the retina in a number of vertebrate species. In this framework, if you are interested you can listen the original voice of Dr. Santiago Ramón y Cajal, talking about the neurons and the plasticity of the visual system in the following record (in Spanish):
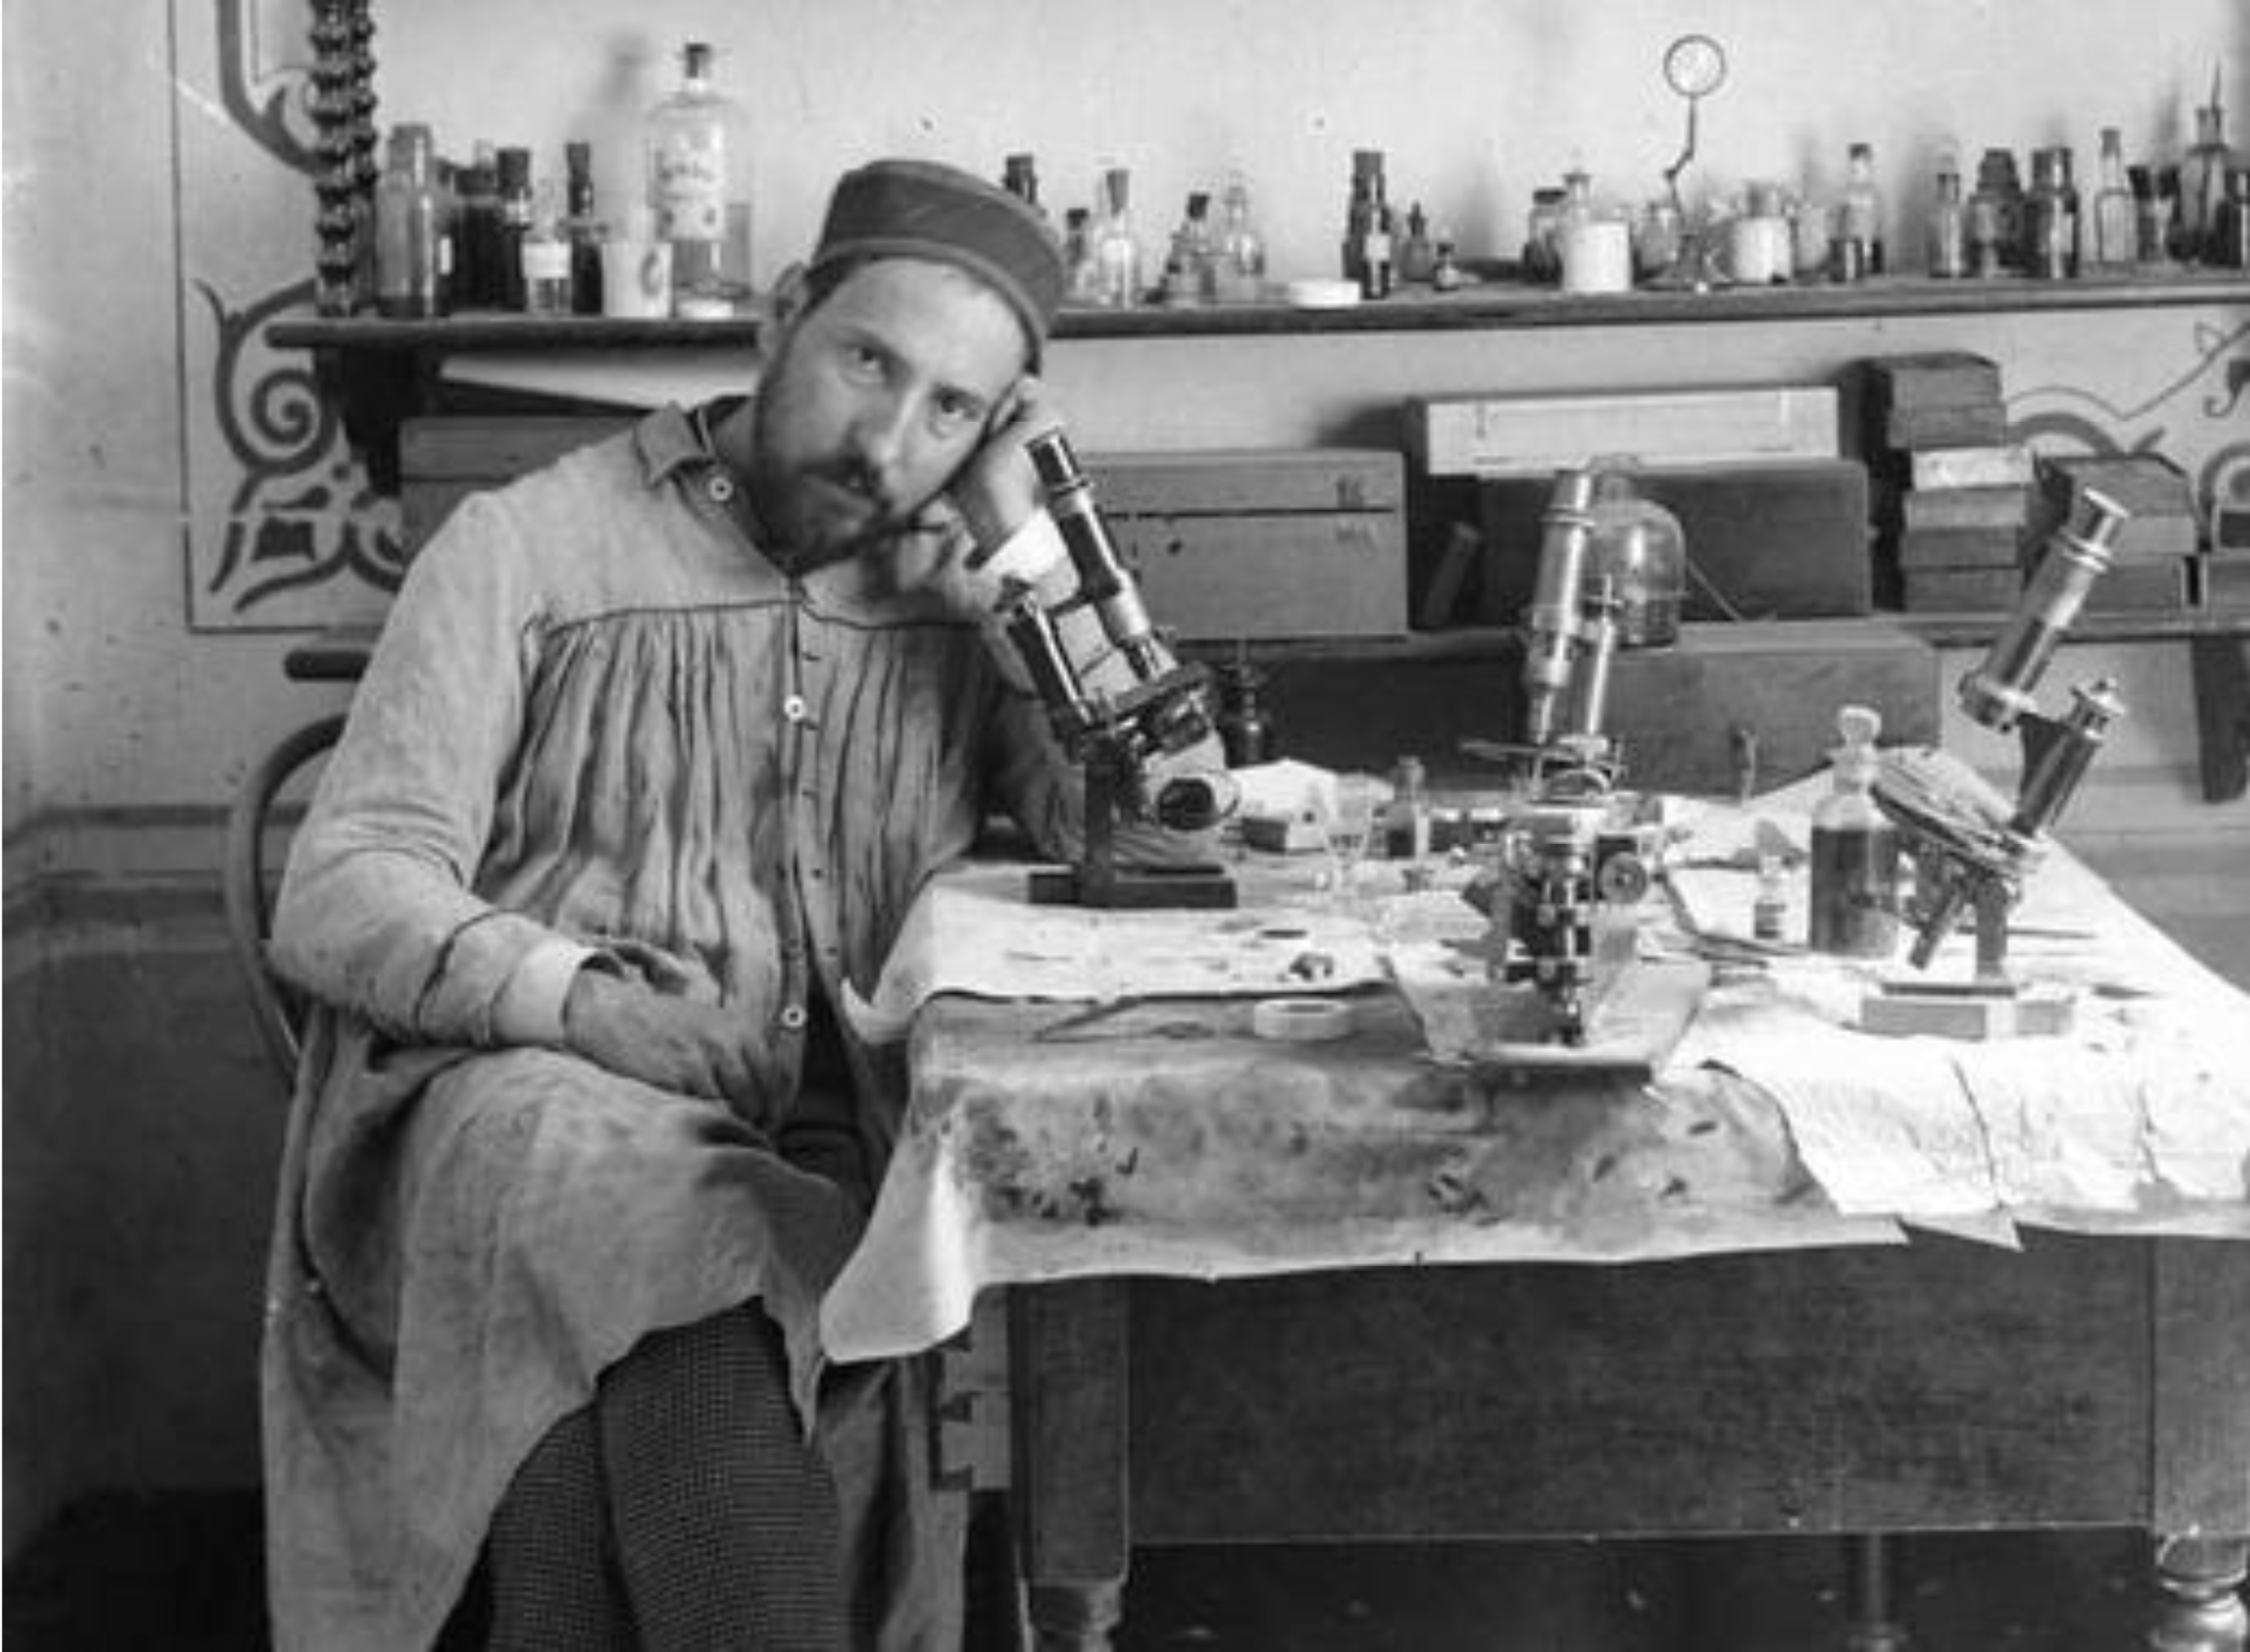
This pioneering work, was followed by a better understanding of the role of visual purple in photochemistry of photoreceptors and important psychophysical studies on image formation, light and dark adaptation and color vision.
By the middle of the 20th century, though, we were beginning to need detailed information of the biophysics, biochemistry and neuroanatomy of circuits that underlie these functions. Newer techniques such as electron microscopy, microelectrode recording, immunostaining and pharmacology allowed us a very rapid advancement of knowledge on the organization of the retina and visual system.
![[Parameter-Settings] FileVersion = 2000 Date/Time = 0000:00:00 00:00:00 Date/Time + ms = 0000:00:00,00:00:00:000 User Name = Yves Nicodem Width = 1124 Length = 996 Bits per Sample = 8 Used Bits per Sample = 8 Samples per Pixel = 3 ScanMode = xy Series Name = 69 MGG syn+cr+cb.lei](http://webvision.org.es/wp-content/uploads/2015/06/Gema69MGG_syn_cr_cb1.jpg)
In the present century we have advanced knowledge of the retina in the areas of molecular biology, evolution and development with stunning new visualization techniques. The purpose of this online book is to summarize our present understanding of the field, based primarily on anatomical and physiological investigations. Over time we have invited famous authors to write chapters on their speciality concerning the retina, higher visual pathways and psychophysics of vision. We also attempt to add clinical research findings in cell biology and retinal diseases. We hope this book will be of general information to all interested in learning about the organization of the retina and visual system and about the basics of visual perception.
We have tried to present material at the cutting edge of the present knowledge, but in a simple way that is accessible to both student, professional and non-expert people.
If you have questions, suggestion for improvements and updates, or other useful comments, do not hesitate to contact us at the following addresses:
Dr. Helga Kolb
helga.kolb@hsc.utah.edu
Dr. Eduardo Fernandez
E.Fernandez@umh.es
Dr. Ralph Nelson
nelsonr@ninds.nih.gov
Dr. Bryan Jones
bryan.jones@m.cc.utah.edu